Chapter 6: LTD Case Studies
This chapter is dedicated to present some examples of using R4All platform to perform an LTD analysis.
6.1 Case Study 1: Vendor Comparison
(The example below is presented in William Q. Meeker and Luis A. Escobar’s book, Statistical Methods for Reliability Data).
The table below gives the number of observed failures from a field-tracking study of circuit packs. The Vendor 2 units had already seen 1,000 hours of burn-in testing at the manufacturing plant, but no information was available about the number of units that had failed in the test. Thus, the Vendor 2 circuit packs are left-truncated. If the number of circuit packs that failed in the burn-in period was known, then the data could be treated as censored.
After 10,000 hours of operation, there were 4,897 functional packs for Vendor 1 and after 11,000 hours of operation, there were 4,924 functional packs for Vendor 2.

To analyze the Vendor 2 data, the approach is to fill in the left column with the time spent in operation/test, and consider the sample collected after this time mark, as shown in the table below:
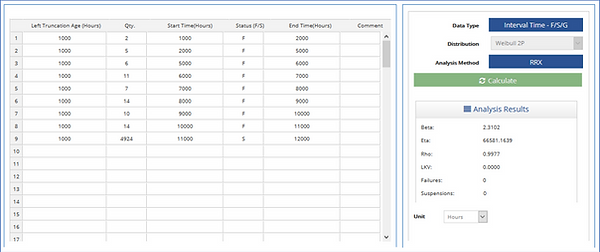
For 50,000 hours of operation, the reliability for Vendor 2 units is displayed below:
